Solar power plants are graded based on mostly two indices, CUF (Capacity Utilisation Factor ) and PR(Performance Ratio). The yield from the power plant is reflected in these metrics.
Let’s discuss the CUF in this section.
Before that, we must know what CUF stands for.
It is the ratio of the actual output from a solar plant over the year to the maximum possible output from it for a year under ideal conditions. Capacity utilisation factor is usually expressed in percentage.
Without getting into the intricacies of calculating the CUF, let’s discuss what CUFs you should expect from your solar power plant.
The CUF is a measure of ‘how well a plant is utilized’. This is especially important because a PV plant is an asset with a limited life, based on an intermittent energy source, and the investor would like to extract as much value from the plant as possible.
A high CUF would inadvertently mean a well maintained and a high-quality power plant. But a low CUF does not imply the same.
Confused?
Expected CUF from solar power plants vary from region to region, nation to nation, because of the differences in climatic conditions along with sunshine availability. The average CUF in a country like Germany, which does not have a high amount of solar irradiation, is touted to be around 12% but in regions closer to the equator, like some places in India, this metric can go up to 19%. This does not mean the power plant installation in Germany is of a lower standard than the one in India.
So how can you use CUF as a base metric to indicate the quality of your power plant?
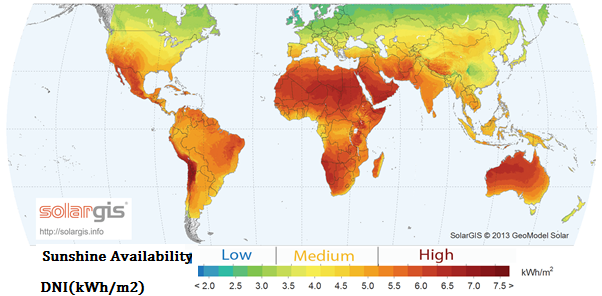
CUF, as a metric to compare between plants, can be used well if used for a comparison between power plants located in the same region. Do check with the CUFs achieved in plants located in the same vicinity or region. The CUFs that can be expected from solar power plants depend on the sunshine availability in a particular region. This sunshine availability is quantified by a metric called Direct Normal Irradiance (DNI)- the amount of solar radiation received per unit area.
Do follow the guidelines below to calculate a rough estimate of the CUF you can expect from your power plant.
- Step 1: Map your location in the following image. Classify the sunshine availability in your region based on the image below:

- Step 2:Rough estimates for CUFs you can expect based on sunshine availability is tabulated below:
Sunshine Availability DNI(kWh/m2) CUF Range(%)
Low <3 11-14%
Medium 3-5 14-16%
High >5 16-18%
So, once you know what the area’s sunshine availability is, ensure that the CUF falls in the % range for the solar power plant.
You might want to check out these questions on Solar Power Plant Evaluation – Plant Performance
- What are the performance guarantees provided by the installer?-Here
- What is the generation data from the power plant? Is it according to the industry standards?-Here
- What have been the cleaning practices for the panels over the years?-Here
- What are the O&M practices followed?-Here
- How do you check the quality of the O&M company and personnel? – Here
- What are the innovations employed in the power plant? How can they impact your financial returns?-Here
- Is there scope for expansion of the power plant, in terms of scale?-Here
- What were the key problems the power plant had faced and what were the causes for these?-Here


Pingback: Solar Power Plant Evaluation - What is the generation data from the solar power plants? Is it according to industry standards? - Solar Mango – #1 guide for solar
Pingback: Super Big FAQs on Solar Power Plant Evaluation - Solar Mango – #1 guide for solar